Liver Elastography: From the Rule of 4 to Confounding Factors in Noninvasive Fibrosis Staging
The 2020 SRU consensus Rule of 4 classifies liver stiffness into five ranges, from ≤ 5.0 kPa to > 17.0 kPa. See the ranges, the 2A/2B modulation, the IQR/M quality criterion, the confounders that overestimate the value and why follow-up is done by the delta.
 LaudárioUltrasound reports in practice
This article is part of the guide Abdominal Ultrasound: A Guide to the Findings That Actually Change Management.
Shear wave liver elastography has turned fibrosis staging from an invasive, painful procedure prone to sampling error into a ten-minute outpatient exam. But it brought a trap with it: the number in kilopascals looks objective and, for that reason, tends to be read as if it were a direct measure of fibrosis. It is not. Liver stiffness is influenced by inflammation, venous congestion, cholestasis and even the postprandial state, and a report that hands over the value without contextualizing these factors can induce a clinical error that a biopsy would not have made.
The 2020 Society of Radiologists in Ultrasound (SRU) consensus organized this interpretation into what became known as the Rule of 4: a ladder of values in approximate multiples of 4 kPa that sorts the patient into five ranges, from a high probability of normality to suspected clinically significant portal hypertension. This text walks through that ladder, the technique that makes it reliable, the factors that corrupt it and the logic of follow-up, which, contrary to what many assume, is not based on the absolute value but on the delta.
What elastography measures, and what it does not
The shear wave technique (SWE, shear wave elastography) works like this: an acoustic radiation force impulse (ARFI) pushes the tissue, generating shear waves that propagate laterally. The system measures the speed of this propagation. The stiffer the tissue, the faster the wave travels. The velocity in meters per second is converted into an elastic modulus in kilopascals by the relationship E = 3ρc², which in practice boils down to kPa = 3 × (m/s)² or, in the opposite direction, m/s = √(kPa/3).
Note what this chain implies. The exam measures stiffness, not fibrosis. Fibrosis is the most common cause of increased stiffness in a chronic liver, but it is far from the only one. A liver congested by heart failure is stiff without being fibrotic. A liver in acute hepatitis is stiff from inflammatory edema. A cholestatic liver is stiff from pressure in the ducts. For this reason, a well-written report never says “grade 3 fibrosis”. It says “median liver stiffness value” and leaves the clinical translation explicitly anchored in context.
This discipline of vocabulary is what separates a mature elastography report from one that merely imitates the biopsy. The METAVIR scale (F0 to F4) describes histology; elastography does not see histology. Reporting F2 from a kPa value is a translation the method does not authorize, and one that the SRU consensus deliberately abandoned by proposing its own classification.
The Rule of 4: the five ranges and what each one decides
The 2020 SRU consensus shifts the target. Instead of trying to pin down the fibrosis stage, it asks something clinically more useful: does this patient have compensated advanced chronic liver disease (cACLD)? This is the condition that defines the risk of decompensation and the need for screening for varices and hepatocellular carcinoma.
The ranges, for liver stiffness values:
- ≤ 5.0 kPa (≤ 1.3 m/s): Class 1. High probability of a normal exam.
- > 5.0 and < 9.0 kPa (1.3 to 1.7 m/s): Class 2. In the absence of other clinical signs, rules out cACLD.
- 9.0 to 13.0 kPa (1.7 to 2.1 m/s): Class 3. Suggestive of cACLD; other tests are needed for confirmation.
- > 13.0 and ≤ 17.0 kPa (> 2.1 m/s): Class 4. Consistent with cACLD.
- > 17.0 kPa (> 2.4 m/s): Class 5. Suggestive of clinically significant portal hypertension (CSPH).
There is a subtlety in Class 2 that is the smartest point of the consensus, and the most ignored in practice. It is subdivided according to the clinical context:
- Class 2A: value between 5 and 9 kPa without clinical signs of advanced chronic liver disease. Here the result has rule-out value: it makes cACLD unlikely.
- Class 2B: the same value, but with known clinical signs of advanced liver disease. Here the result is indeterminate: it is below the rule-out threshold, but the clinical signs prevent the disease from being excluded. Additional tests are needed.
In other words, the same number yields two opposite conclusions depending on the patient on the table. This modulation exists only in this range: clinical signs do not reclassify any other class. It is the formal recognition, within the rule itself, that elastography is a probability test, not an oracle.
There is also a cross-cutting cutoff worth knowing, although it is not a class: values below 7 kPa (about 1.5 m/s) are associated with a low probability of significant fibrosis, in the absence of confounders. This is useful information for the clinician, but it falls within range 2 and should be offered as additional interpretation, not as a substitute for the classification.
Etiology matters: not every liver obeys the Rule of 4
This is probably the least known point in daily practice. The Rule of 4 thresholds were validated in specific populations, and the literature supports their use solidly in three etiologies:
- Viral hepatitis B (HBV)
- Viral hepatitis C (HCV)
- MASLD/MASH: metabolic dysfunction-associated steatotic liver disease
Outside this trio (alcohol-related liver disease, autoimmune hepatitis, primary biliary cholangitis, primary sclerosing cholangitis), the data are insufficient for definitive recommendations based on these cutoffs. This does not mean the exam is useless in these etiologies; it means the value should be reported with an explicit caveat and interpreted in correlation with specialized clinical and laboratory evaluation. A report that applies MASLD thresholds to a patient with active alcohol-related liver disease, without any caveat, is extending the validity of the method beyond what the evidence authorizes.
In practice, this means the underlying etiology needs to appear in the report. An elastography exam without etiologic context is an orphan number.
Technique is half the result
No classification can save a poor acquisition. The technical criteria are not a formality: they determine whether the number means anything.
Number of measurements
It depends on the technique. For 2D-SWE, the recommended standard is 5 measurements. For pSWE/point ARFI, it is 10 measurements. Below 5, accuracy drops and the report should say so. An exam with three measurements is not a quick exam: it is an exam of reduced reliability, and that caveat belongs in the document.
IQR/M: the quality criterion that decides whether the number is valid
The ratio between the interquartile range and the median, expressed as a percentage, is the main indicator of reliability. It measures the dispersion among the measurements, that is, how much the liver “agreed with itself” across the acquisition.
- IQR/M ≤ 30%: adequate quality.
- IQR/M > 30% and ≤ 40%: borderline quality; values should be interpreted with caution.
- IQR/M > 40%: inadequate quality; values are not reliable for isolated interpretation.
This datum should appear in the report next to the median, always, not hidden in a technical footer. A value of 12 kPa with an IQR/M of 45% and a value of 12 kPa with an IQR/M of 10% are radically different clinical documents, and the referring physician has no way of knowing that unless the report says so.
Fasting, position and depth
Three acquisition conditions that measurably change the result:
- Fasting for at least 4 hours. Postprandial hyperemia increases portal flow and overestimates stiffness. If fasting was not confirmed, the caveat belongs in the report: a patient who had lunch before the exam can gain a few kPa that have nothing to do with fibrosis.
- Supine position, right arm extended (maximum abduction), neutral breath-hold. The neutral breath-hold matters: forced breath-holding, whether inspiratory or expiratory, alters intrathoracic pressure and venous return, and with them the measured stiffness. When the patient cannot cooperate with breath-holding, the report records that the measurements were made during free breathing and should be interpreted with caution.
- Depth of at least 20 mm below the liver capsule, in the right lobe, by an intercostal approach. Measurements close to the capsule systematically overestimate stiffness, because the capsule is stiff by nature.
Confounding factors: a false number versus an unreliable number
There is a conceptual distinction worth organizing mentally, because it changes what is written in the conclusion. Some factors produce a false number: the acquisition was technically perfect, but the liver is genuinely stiffer for a reason that is not fibrosis. Others produce an unreliable number: the physics of the acquisition was compromised.
Factors that overestimate stiffness (biological bias)
- Elevated transaminases (ALT and/or AST above 5 times the upper limit): hepatocellular inflammation increases stiffness regardless of the degree of fibrosis. It is probably the most common cause of overestimation in practice, and the easiest to check: just look at the lab results.
- Active acute hepatitis: same logic, to a greater degree. Ideally, measure after the inflammatory condition has resolved.
- Obstructive cholestasis: pressure in the biliary system increases stiffness. The exam should be repeated after the obstruction is resolved.
- Passive hepatic congestion: shown by Doppler of the hepatic veins and the inferior vena cava. This is the most treacherous confounder, because the cardiac patient often also has metabolic risk factors.
- Heart failure: here there is an interesting inversion: stiffness may reflect the degree of venous congestion, not the degree of fibrosis, and in this context it can be useful precisely as a parameter for hemodynamic follow-up, compared with the patient's own baseline.
- Infiltrative disease (amyloidosis, lymphoma, extramedullary hematopoiesis): makes the values nonspecific for fibrosis assessment.
Factors that limit technical applicability (acquisition bias)
- Marked obesity: limited acoustic window, compromising the generation and propagation of shear waves.
- Large-volume ascites: fluid does not transmit shear waves; the interposition compromises accuracy.
- Severe steatosis: attenuates the ultrasound and limits penetration of the ARFI pulse to the ideal depth.
- Nodule or focal lesion in the acquisition region: introduces variability and compromises interpretation of the values as representative of the diffuse parenchyma.
Two generic confounders are also worth mentioning, often forgotten because they have no field of their own in any form: the postprandial state and recent physical exercise, both capable of raising stiffness by increasing splanchnic flow.
Spleen elastography: when the liver does not answer the right question
There is a question that liver stiffness answers poorly: does the patient have clinically significant portal hypertension and a risk of varices? Liver stiffness saturates: beyond a certain point, the cirrhotic liver does not become proportionally stiffer as portal pressure rises. The spleen does.
The Baveno VII model incorporated spleen stiffness measurement (SSM) as a complementary tool, with its own cutoffs:
- < 21 kPa: rules out CSPH, with a high probability of also ruling out cACLD.
- 21 to 50 kPa: diagnostic gray zone.
- > 50 kPa: consistent with CSPH and a high risk of gastroesophageal varices.
The quality criteria follow the same logic as for the liver (IQR/M ≤ 30%), and the technical limitations are specific: gas interposition, an unfavorable window and, particularly, a small-volume spleen, which is ironic, since a small spleen is precisely what makes portal hypertension less likely.
The great clinical utility is the possibility of sparing screening endoscopies in patients who fall below the rule-out threshold. It is a complementary block (it does not need to be in every report), but when the clinical question is portal hypertension, it adds more than any refinement of the liver value.
Follow-up: the delta matters more than the value
This is the point where practice most often departs from the consensus. The temptation is to compare today's value with the table and conclude “improved” or “worsened”. The SRU consensus recommends the opposite: follow-up is done by the relative change delta, not by the absolute value.
The threshold is 10%. Changes of up to 10% between consecutive exams are within expected variability and should be read as stability. Changes above 10% upward suggest progression of stiffness; downward, improvement.
And here comes the detail that should change the routine of any service: variability between systems from different manufacturers can reach 10%, exactly the same value as the clinical significance threshold. The consequence is direct and uncomfortable: if the patient had the previous exam on one machine and the current one on another, the comparison loses practically all its detection power. Switching machines between follow-up exams erases the signal you are trying to measure. Whenever possible, follow-up should be done on the same equipment, and when it is not, the caveat belongs in the report.
The question of the baseline after treatment
Two scenarios require a conceptual care that almost never appears in reports:
- After HCV eradication with direct-acting antivirals. Stiffness falls quickly after sustained virologic response, and it is tempting to interpret this drop as fibrosis regression. For the most part, it reflects a reduction in inflammatory activity, not fibrotic remodeling. The value obtained right after eradication should not be used alone for staging. For follow-up, the correct baseline is the value after documented eradication, and monitoring is done by the delta from there on.
- After HBV viral suppression. Same logic: the baseline for longitudinal follow-up is the value obtained after documented suppression.
In both cases, a report that does not make this explicit feeds a wrong clinical conclusion (that fibrosis has regressed) from technically correct data.
Multiparametric assessment: stiffness and fat confound each other
Ultrasound quantification of liver fat, by attenuation in dB/cm/MHz or by fat fraction as a percentage depending on the manufacturer's technology, has entered routine practice alongside elastography. It is worth knowing the interaction between the two, because it is bidirectional and not at all intuitive:
- Severe steatosis attenuates the ultrasound and degrades elastography, limiting pulse penetration to the ideal depth.
- Advanced fibrosis overestimates attenuation, inflating the fat estimate.
In other words, each method confounds the other. That is exactly why multiparametric assessment (stiffness, fat and B-mode read together, in the same exam) delivers more than the sum of its parts. It is also why a serial table crossing stiffness, steatosis and date over time says more about the patient with MASLD than any isolated value.
A practical note: steatosis cutoffs vary by manufacturer. Each technology (Samsung USFF and TAI, GE UGAP, Canon ATI, Siemens UDFF, Philips) has its own thresholds for S0, S1, S2 and S3. Applying the cutoff of one system to the value of another is a silent and common error.
Pitfalls of the liver elastography report
- Reporting a METAVIR stage from the kPa: the method measures stiffness, not histology; the translation is not authorized.
- Omitting the IQR/M: without it, the referring physician has no way of knowing whether the number is reliable.
- Applying the Rule of 4 to nonvalidated etiologies without a caveat: alcohol-related, autoimmune, PBC and PSC require explicit caution.
- Ignoring elevated transaminases: inflammation overestimates stiffness regardless of fibrosis, and checking it costs one look at the lab results.
- Not checking for congestion in cardiac patients: a congested liver is stiff without being fibrotic.
- Comparing exams from different systems without a caveat: inter-system variability equals the significance threshold.
- Concluding fibrosis regression after antiviral treatment: the early drop reflects inflammation, not remodeling.
- Measuring without confirmed fasting and not recording it.
- Measuring close to the capsule: less than 20 mm systematically overestimates.
- Delivering the value without the class: “10.5 kPa” alone forces the clinician to consult a table they may not have.
How Laudário helps structure the elastography report
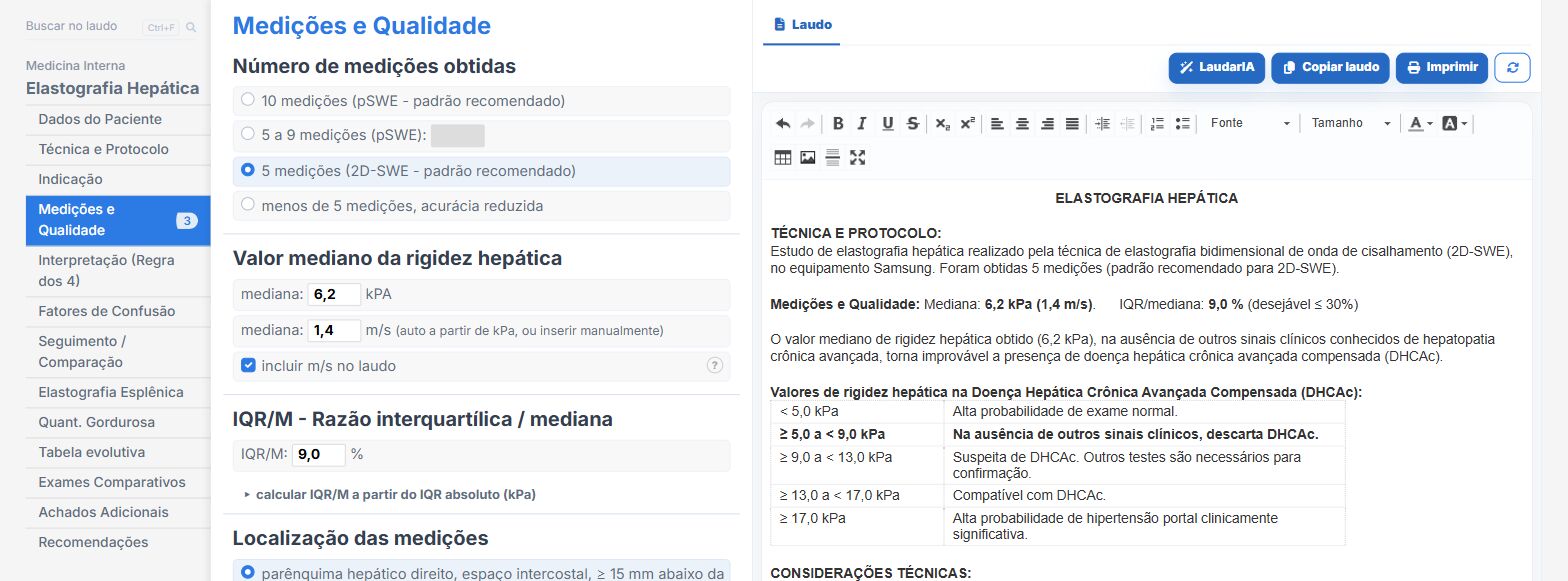
Laudário has a liver elastography module that treats the exam for what it is: a physical measurement that needs context to become clinical information. In practice, this means:
- Automatic classification by the Rule of 4 from the entered value, with automatic conversion between kPa and m/s in both directions, eliminating table errors during quick typing.
- 2A/2B modulation controlled by context: the clinical signs field is available only within the range where it actually changes the conclusion, preventing the examiner from applying the modulation where it does not exist.
- IQR/M calculation and classification, with an auxiliary calculator from the absolute IQR and automatic alerts in the borderline and inadequate ranges, and the value printed next to the median in the report, always.
- Automatic synchronization of the recommended number of measurements according to the chosen technique (5 for 2D-SWE, 10 for pSWE), with an automatic caveat when the number obtained is below the standard.
- Automatic caveat for nonvalidated etiology, ensuring the thresholds are not silently applied outside the populations in which they were studied.
- A dedicated tab for confounding factors, separating those that overestimate stiffness from those that limit the technique, with ready-made phrases that explain to the clinician why the value should be read with caution.
- A follow-up block that calculates the relative change delta and automatically classifies it against the 10% threshold, with an alert when the exams were done on different equipment and specific phrases for the post-DAA, post-HBV suppression, cardiac congestion and post-TIPS or transplant contexts.
- Complementary spleen elastography with the Baveno VII cutoffs and its own quality criteria, and a serial table that crosses stiffness, fat fraction and date in the same view.
- Bibliographic references printed automatically in the report (Barr et al., Radiology 2020, for the liver consensus; Jachs et al., Lancet Gastroenterol Hepatol 2023, for the spleen model), which lends authority to the document delivered to the hepatologist.
- Support from LaudarIA, the integrated artificial intelligence, to help write complex interpretations: multiple simultaneous confounders, patients in long-term follow-up, or cases in which stiffness and steatosis contradict each other.
The result is a report that the hepatologist can use without having to reinterpret it: the class, the quality criterion, the etiologic context, the confounders and the delta, all in the right place. In an exam whose number has the appearance of absolute truth, the sonologist's greatest contribution is precisely to deliver the number together with its conditions of validity.
If you already perform liver elastography but still build the report manually, it is worth trying: Laudário offers a 15-day free trial, no credit card, with immediate access to the liver elastography modules, fat quantification, multiparametric liver assessment and all the other routine protocols.
The ultrasound reporting platform built by sonologists. We write about reports, classifications and standardization from the real routine of the practice. Who writes and how.
Educational content for healthcare professionals. It does not replace clinical judgment or the guidelines adopted by your service. Editorial policy.